반응형
아래의 ADR 은 직접계산하여 제공한다.
- 계산관련 포스팅 : ADR 수치 및 그래프 직접 그리기
- 히스토리
- 2022-07-01 서비스시작
- 2022-08-08 정상복구 완료
- 2022-08-16 미동작관련 서비스재가동
- 2022-08-31 직접 adr 계산값으로 변경완료
없으면 만든다.
- 직접크롤링하여 그래프를 그린다.
- 매일 자동으로 업데이트 된다. (업데이트시간 : 18시)
- 이미지상단에 업데이트 시간확인가능
- 1일 1회 장끝난 시점에서 그림
- 마커를 통해서 상세수치 확인 가능
...
- 특이사항
- 일반적으로 20일 기준으로 사용하는것 같아 20일 기준으로 계산.
- 직접 계산한 ADR값은 유진투자증권과 http://www.adrinfo.kr/ 에서 제공하고있는 값하고는 달랐다.
- 위의 사이트들과의 오차는 대략 1 ~ 4 사이였다. (그정도의 오차는 크게 의미없는 수치라고 생각한다.)
- 기존사이트 adr제공 사이트들는 어떻게 계산을 하는지에 대한코드가 공개되지 않은상태 이다보니 기존사이트와 데이터가 완벽하게 동일하지는 않다.
- 계산식은
일정기간의 상승종목수 / 일정기간의 하락종목수 * 100으로 계산 하였으므로, 기존사이트의 데이터와 수치가 약간 차이나는건 크게 의미를 두지 않아도 될듯.
1 ADR 그래프
본포스팅의 그래프는 항상 최신으로 업데이트 된다.
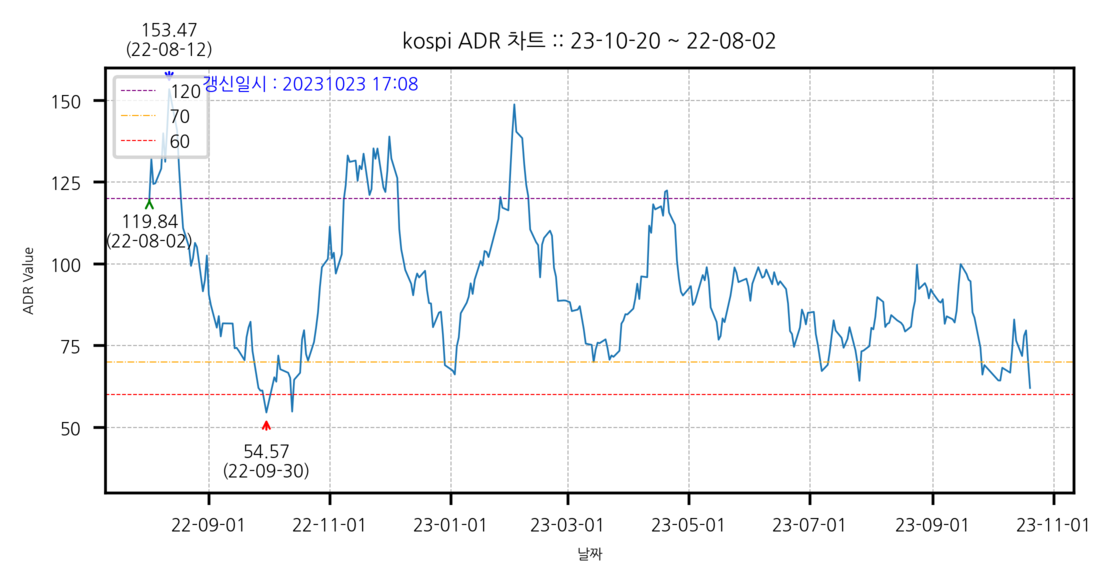
1.1 kospi ADR 1년치 그래프
https://raw.githubusercontent.com/kksworks/stock_data_asset/master/adr_graph/adr_kospi_daily.png
1.2 kosdaq ADR 1년치 그래프
https://raw.githubusercontent.com/kksworks/stock_data_asset/master/adr_graph/adr_kosdaq_daily.png

2 구글시트에 ADR 넣기
위의 이미지를 구글시트에 실시간 ADR 차트를 넣을수 있다.
=IMAGE("https://raw.githubusercontent.com/kksworks/stock_data_asset/master/adr_graph/adr_kospi_daily.png",3)
=IMAGE("https://raw.githubusercontent.com/kksworks/stock_data_asset/master/adr_graph/adr_kosdaq_daily.png",3)
3 그래프 만드는 파이썬코드
위의 그래프는 직접 파이썬으로 작성하였다.
관련코드는 다음과같다. (전체코드는 다 공개는 못하지만, 대략적인 주석으로 참고는 가능할듯)
def mk_adr_graph(adr_type) :
    _log_ctx.dbg('start...')
    y_axis = []
    x_axis = []

    session = base.Session()
    adr_infos = session.query(stockADRInfo).filter(stockADRInfo.adr_type == adr_type).order_by(stockADRInfo.기준일.asc()).limit(300).all()
    for adr_info in adr_infos:
        y_axis.append(adr_info.adr_val)
        x_axis.append(adr_info.기준일)


    # 그림 관련 기본생성..
    fig, ax = plt.subplots(figsize=(5, 2.5))
    plt.plot(x_axis, y_axis, linewidth=0.5)

    # x 축을 datetime 으로 변경..
    dateFmt = mdates.DateFormatter('%y-%m-%d')

    # 3. x축 레이블을 포맷팅한다.
    ax.xaxis.set_major_formatter(dateFmt)

    # x축 라벨 45도로 돌림
    plt.xticks(fontsize=5)
    plt.yticks(fontsize=5)

    # 그리드 돌림
    plt.grid(True,linewidth=0.3, linestyle='--')
    # plt.show()

    # 각종 텍스트 라벨설정
    plt.title('{adr_type} ADR 차트 :: {start_day} ~ {end_day}'.format(adr_type=adr_type, start_day=x_axis[0].strftime('%y-%m-%d'), end_day=x_axis[-1].strftime('%y-%m-%d')),fontsize=6)
    plt.xlabel('날짜',fontsize=4)
    plt.ylabel('ADR Value',fontsize=4)

    plt.ylim([30, 160])      # X축의 범위: [xmin, xmax]
    # plt.ylim([0, 5])      # X축의 범위: [xmin, xmax]

    # max 좌표
    ymax = max(y_axis)
    xpos = y_axis.index(ymax)
    xmax = x_axis[xpos]

    ax.annotate('{ymax}\n({xmax})'.format(ymax=ymax, xmax=xmax.strftime('%y-%m-%d')), xy=(xmax, ymax), xytext=(xmax, ymax+15),
                arrowprops=dict(color='blue', linewidth=0.6, arrowstyle='->'),transform=ax.transAxes, ha='center', va='center', fontsize=5
                )

    # min 좌표
    ymin = min(y_axis)
    xpos = y_axis.index(ymin)
    xmin = x_axis[xpos]

    ax.annotate('{ymin}\n({xmin})'.format(ymin=ymin,xmin=xmin.strftime('%y-%m-%d')), xy=(xmin, ymin), xytext=(xmin, ymin-15),
                arrowprops=dict(color='red', linewidth=0.6, arrowstyle='->'),transform=ax.transAxes, ha='center', va='center', fontsize=5
                )

    # last 좌표
    ylast = y_axis[-1]
    xpos = y_axis.index(ylast)
    xlast = x_axis[xpos]

    ax.annotate('{ylast}\n({xlast})'.format(ylast=ylast,xlast=xlast.strftime('%y-%m-%d')), xy=(xlast, ylast), xytext=(xlast, ylast-10),
                arrowprops=dict(color='green', linewidth=0.6, arrowstyle='->'),transform=ax.transAxes, ha='center', va='center', fontsize=5
                )

    # 보조선
    plt.axhline(y=120, color='purple', linewidth=0.3, linestyle='--', label='120')
    # ax.annotate('60', xy=(x_axis[-1], 60),xytext=(x_axis[-1], ylast-10),transform=ax.transAxes)
    plt.axhline(y=70, color='orange', linewidth=0.3, linestyle='-.', label='70')
    plt.axhline(y=60, color='red', linewidth=0.3, linestyle='--', label='60')

    # 보조선 설명박스
    plt.legend(loc='upper left', fontsize=5 );

    # 텍스트
    suffix_str = ''
    cur_time = datetime.datetime.today().strftime('%Y%m%d %H:%M')
    cur_info = '갱신일시 : {cur_time}'.format(cur_time=cur_time)
    #    adr_last_str += str(cur_adr_infos[adr_type]['current_time']) + ' '
    #    adr_last_str += cur_adr_infos[adr_type]['current_adr'] + ' '
    #    adr_last_str += cur_adr_infos[adr_type]['current_diff'] + ' '
    plt.gcf().text(0.1,0.95, cur_info, color='blue', fontsize=5,transform=ax.transAxes)
    suffix_str = 'daily'
    # 하단에 여백 강제설정
    plt.gcf().subplots_adjust(bottom=0.20)

    # 파일저장하기

    target_path = str(pathlib.PurePath(config.working_path,'public', 'adr_{adr_type}_{suffix_str}.png'.format(adr_type=adr_type,suffix_str=suffix_str)))
    _log_ctx.dbg('save target :: ' + target_path)
    try:
        plt.savefig(target_path, dpi=500, bbox_inches='tight', pad_inches=0.09)
    except Exception as e:
        _log_ctx.err('image save  fail....')
        _log_ctx.err(e)

    _log_ctx.dbg('success??? ')

    return True
...
...
- 해당 포스팅은 tistory-posting-cli 를 이용해 발행되었습니다.
반응형